Transforming raw data into actionable insights
through visual and analytical tools to support
strategic decision-making
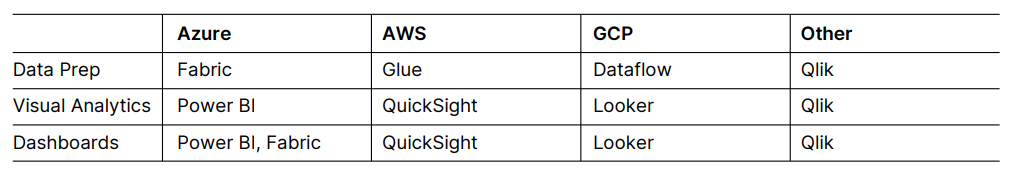
Data only becomes a competitive advantage when the right people can understand and act on it. Business Intelligence and Data Visualization bridge the gap between raw data and strategic decision-making — transforming complex datasets into clear, interactive dashboards, real-time reports, and visual insights that empower every level of the organisation. AdvanceWorks designs and delivers end-to-end BI solutions, from data preparation and analytical processing to anomaly detection and self-service analytics, using best-in-class tools including Power BI, Microsoft Fabric, Qlik, and Looker. Whether building enterprise-wide performance dashboards, automating management reporting, or improving forecasting accuracy, we help organisations develop a genuinely data-driven culture — where decisions are faster, more transparent, and grounded in evidence.
Why it matters
Actionable Insights
Evidence-based Decisions
Collaboration
Transparency
Data-Driven Culture
Key elements
Data Prep
Reporting
Visualizations
Dashboards
Real-time Alerts
Anomaly Detection
Tools
Key use cases
Enterprise Dashboards
Management Reporting
Anomaly Alerts
Self-service Analytics
Forecasting Accuracy
AdvanceWorks site uses Cookies to improve your navigation experience and statistics. By visiting us you are allowing their use.I agreeLearn More